Navigating the financial markets can be a complex endeavor, where understanding and predicting price movements are paramount to successful trading. Among the myriad of tools available to traders, one stands out as a time-tested and invaluable ally: candlestick charts. These simple yet powerful visual representations have been an essential part of technical analysis for centuries, providing insights into market trends and sentiments.
In this comprehensive article, we embark on a journey to unlock the power of candlestick charts. From their intriguing historical origins to the intricacies of their anatomy, we delve into the mechanics of these remarkable charts.
Unlocking the Power of Candlesticks: A Crucial Tool for Trading Analysis
Candlestick charts are an essential tool for technical analysis, offering a visual representation of market dynamics. They provide valuable insights into price movements during specific time frames, whether it’s a day, 4 hours, 15 minutes, or others.
By examining a candlestick, you gain critical information about the opening, highest, lowest, and closing prices, helping you understand market trends. The flexibility of candlesticks allows them to be used independently or in conjunction with technical analysis tools like moving averages and momentum oscillators. Additionally, they can be integrated into broader market theories such as the Dow Theory or the Elliott Wave Theory.
Throughout the history of trading, emotions like fear, greed, and hope have influenced market directions. Candlestick analysis brings clarity to these psychological factors by revealing how buyers and sellers interact.
Compared to traditional bar charts, candlesticks offer superior real-time information, presenting all the trading signals of bar charts while providing additional clarity and generating extra signals. This advancement in interpreting market behavior is a significant step forward in trading analysis. Embrace the power of candlestick charts to gain a deeper understanding of market movements and participants’ behavior.
How to Read a Candlestick Chart
The open and close prices form a fundamental aspect of a candlestick chart. When the close price is higher than the open price, the candlestick is termed bullish, indicating a price increase during that period. Bullish candlesticks are typically represented as green or white.
Conversely, if the close price is lower than the open price, the candlestick is labeled bearish, signifying a price decrease during that period. Bearish candles are commonly depicted as red or black.
It’s important to note that while these colors are frequently used to represent candlesticks, trading platforms and exchanges often provide users the flexibility to customize these colors according to their preferences.
A brief summary of the candlestick anatomy
The filled part of the candlestick is the body.
The thin lines above and below the body are known as shadows.
While sometimes referred to as “wicks,” it’s a misconception. Only the top line is considered a wick, and the bottom line should be called the tail.
The top of the upper shadow represents the maximum price reached within the chosen time frame.
The bottom of the lower shadow indicates the minimum price reached within the chosen time frame.
Unraveling the Past: A Brief History of Candlestick Charts
Candlestick charts have a rich history that predates similar Western instruments. While the first US charts emerged in the late 19th century, the Japanese had been using candlestick charts as early as the 17th century.
The Japanese diligently guarded their knowledge of candlesticks until the 1980s when the global intermingling of banks and financial institutions brought about significant changes.
This period marked the introduction of these mystical tools to the Western world, coinciding with the rise of computers, which simplified the charting process.
In the late 1980s, Western analysts, including Michael Feeny of TA London, began incorporating candlesticks into their daily work and sharing the concept with other professionals in London.
The interest in candlesticks continued to grow, with individuals like Steve Nison, a technical analyst at Merrill Lynch in New York, publishing a paper in the December 1989 issue of Futures. In the paper, Nison showcased various candlestick patterns and explained their predictive abilities. He later authored a book on the subject.
Since then, candlestick charts have gained popularity year by year, becoming the standard template for most analysts today. Their widespread adoption has revolutionized financial analysis and transformed the way professionals interpret market patterns and trends.
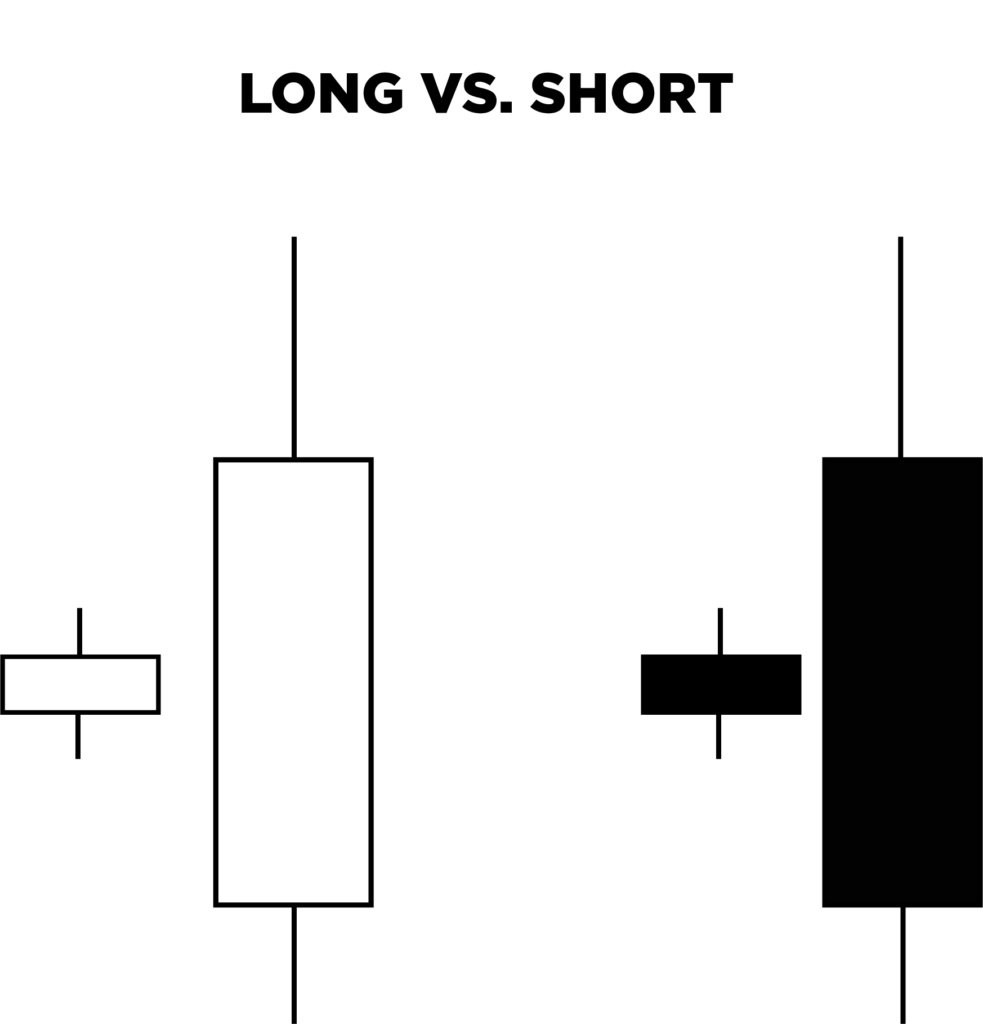
Candlestick sizes
Candlesticks display varying body sizes, with long bodies indicating strong buying or selling pressure. When a candlestick closes with a long body above its opening price, it signifies that buyers dominated the market during that specific time frame.
On the other hand, if the candlestick closes with a long body below its opening price, it indicates that selling pressure was in control during that respective period.
While short and small bodies may suggest limited buying or selling activity, this isn’t always the case. In such instances, it’s crucial to monitor other tools like trading volume. High volume can occasionally imply market participants’ indecisiveness about the market’s overall direction, with bulls and bears ‘battling’ for control. A deeper analysis beyond the candlestick’s body size provides a comprehensive view of the market dynamics.
Candlestick Shadows
The top and bottom shadows of candlesticks hold crucial insights into the trading session. Candlesticks with short shadows indicate that the majority of transactions occurred near the opening and closing prices. On the other hand, candlesticks with long shadows reveal that numerous trades took place well beyond the candlestick’s opening and closing prices. These shadow lengths provide valuable clues about the price range and volatility experienced during the trading session.
When a candlestick exhibits a long upper shadow and a short lower shadow, it suggests a temporary surge in buying pressure due to a price spike. However, this also indicates that selling pressure intensified during that period, causing the price to slightly decline towards the opening price by the end of the timeframe.
Similarly, when a candlestick has a longer lower shadow than an upper shadow, the roles are reversed. This pattern signifies a momentary increase in selling pressure, leading to a price dip, but eventually recovering towards the opening price as the timeframe concludes. Understanding these shadow patterns provides valuable insights into market dynamics and the balance between buying and selling forces.
Bryan
Bryan indulges in every bit of crypto-related news
and material he can lay his hands on. As such, he
often shares his views and advice through the onXRP content platform. He is a firm believer in crypto’s
potential in the financial and economic world. With
5 years of experience in investing and trading Bryan
brings excellent insights to the table. He is excited to
bring much of this knowledge and many of his
skills to the onXRP platform.
We use cookies on our website to give you the most relevant experience by remembering your preferences and repeat visits. By clicking “Accept All”, you consent to the use of ALL the cookies. However, you may visit "Cookie Settings" to provide a controlled consent.
This website uses cookies to improve your experience while you navigate through the website. Out of these, the cookies that are categorized as necessary are stored on your browser as they are essential for the working of basic functionalities of the website. We also use third-party cookies that help us analyze and understand how you use this website. These cookies will be stored in your browser only with your consent. You also have the option to opt-out of these cookies. But opting out of some of these cookies may affect your browsing experience.
Necessary cookies are absolutely essential for the website to function properly. These cookies ensure basic functionalities and security features of the website, anonymously.
Cookie
Duration
Description
cookielawinfo-checkbox-analytics
11 months
This cookie is set by GDPR Cookie Consent plugin. The cookie is used to store the user consent for the cookies in the category "Analytics".
cookielawinfo-checkbox-functional
11 months
The cookie is set by GDPR cookie consent to record the user consent for the cookies in the category "Functional".
cookielawinfo-checkbox-necessary
11 months
This cookie is set by GDPR Cookie Consent plugin. The cookies is used to store the user consent for the cookies in the category "Necessary".
cookielawinfo-checkbox-others
11 months
This cookie is set by GDPR Cookie Consent plugin. The cookie is used to store the user consent for the cookies in the category "Other.
cookielawinfo-checkbox-performance
11 months
This cookie is set by GDPR Cookie Consent plugin. The cookie is used to store the user consent for the cookies in the category "Performance".
viewed_cookie_policy
11 months
The cookie is set by the GDPR Cookie Consent plugin and is used to store whether or not user has consented to the use of cookies. It does not store any personal data.
Functional cookies help to perform certain functionalities like sharing the content of the website on social media platforms, collect feedbacks, and other third-party features.
Performance cookies are used to understand and analyze the key performance indexes of the website which helps in delivering a better user experience for the visitors.
Analytical cookies are used to understand how visitors interact with the website. These cookies help provide information on metrics the number of visitors, bounce rate, traffic source, etc.
Advertisement cookies are used to provide visitors with relevant ads and marketing campaigns. These cookies track visitors across websites and collect information to provide customized ads.