As a trader, one of the most crucial skills you must possess is the ability to read and comprehend market structure, particularly market trends. This skill enables you to apply the right price-action strategies in different market conditions, and as the saying goes, “The trend is your friend until the end.”
Market structure refers to how the market behaves during a specific period of time. It helps us determine who is in control of the market—bulls or bears. Analyzing market structure is a valuable tool used by many investors to decide when to enter, exit, or stay away from the market.
By closely observing price action, three main types of market structures can be identified: trending, ranging, and choppy. In this article, we will delve into each of these market types to help you recognize and understand them better, enabling you to make more informed decisions while navigating the charts.
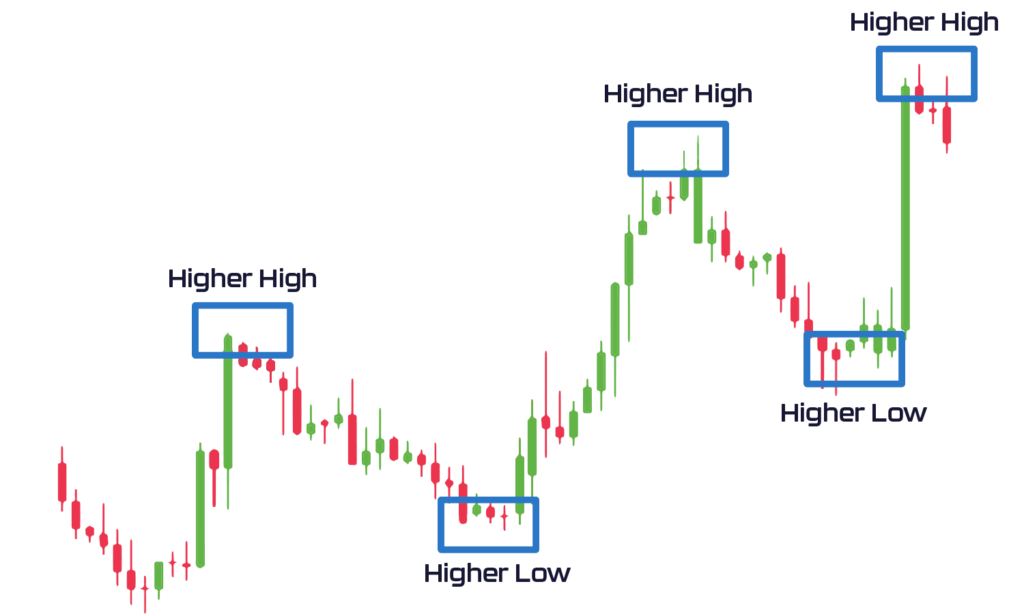
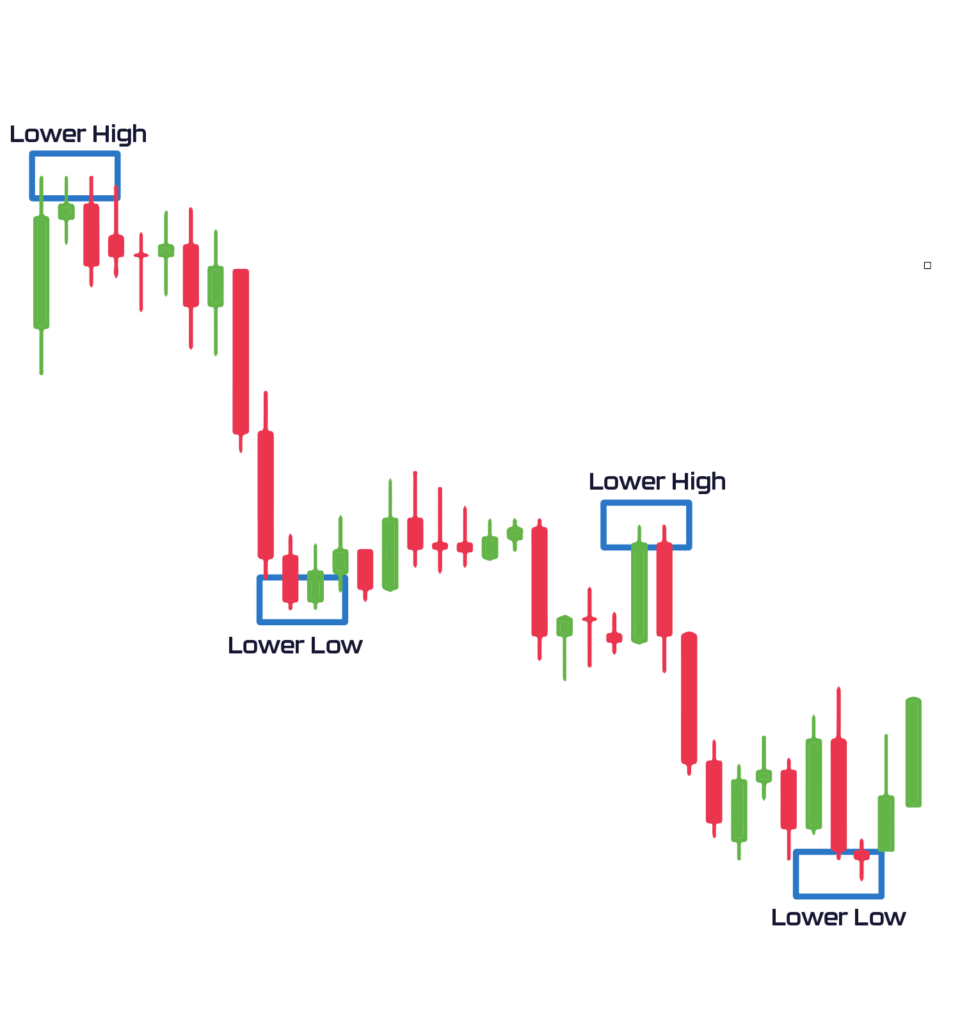
Trending markets are aptly named for their distinctive pattern of repeated upward or downward price movements. An uptrend is characterized by a sequence of “higher highs and higher lows,” signifying a continuous upward movement, while a downtrend exhibits “lower highs and lower lows,” representing a consistent downward movement. Let’s explore some examples to illustrate these sequences.
As seen in the example above, the market is forming a pattern of higher highs and higher lows, which clearly indicates that the market is currently experiencing an uptrend. This pattern signifies that the trend has gained “bullish momentum,” suggesting a trend where prices are consistently rising due to a surge in new buyers entering the market at progressively higher prices.
On the contrary, in the provided example, the market is clearly in a downtrend. The “lower highs and lower lows” pattern signifies a weakening support, leading to a decline in price levels. This market structure demonstrates a bearish momentum, with new sellers entering the market and driving prices lower.
In general, identifying market trends is relatively straightforward: Higher lows and higher highs indicate an upward market movement, while lower lows and lower highs suggest a downward trend. In future articles, we will delve into more comprehensive explanations of market movements, including cycles and theories like Elliot Wave counts, which provide insights into the price movements over time.
What Are Ranging Markets?
Ranging markets, sometimes humorously referred to as “straightforward” (pun intended), are characterized by their sideways movement or accumulation phases, where the price drifts horizontally for a period of time.
This market structure can be observed in various scenarios, such as when the market has reached its peak after an uptrend, during consolidation phases between further up or downtrends, or when the market is reaching a bottom after a downtrend.
In this phase, neither buyers nor sellers have a clear advantage, resulting in a momentary equilibrium point between two price levels where supply and demand meet. During this time, the market is essentially undecided and lacks a clear direction.
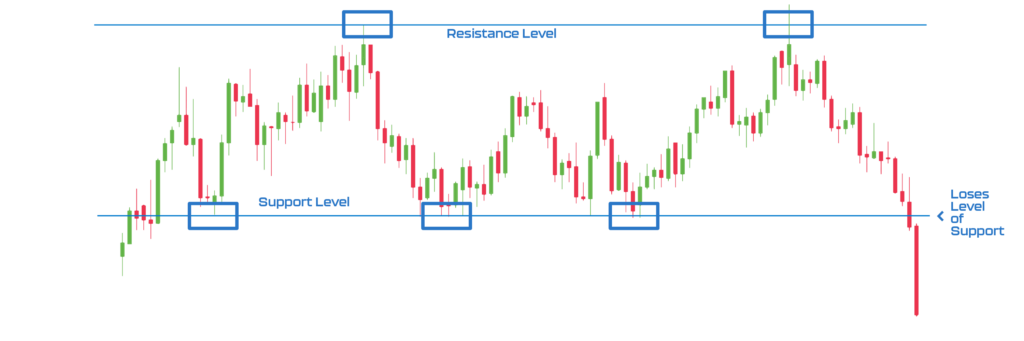
The chart above illustrates a classic example of a ranging market, where the price remains confined between two distinct support and resistance levels. This specific pattern resembles an ‘M’ or double top formation. In this scenario, the market attempts to break through a price level twice, having initially breached the resistance. However, it gets rejected at the upper price boundary, causing the price to reverse and fall. As a result, the trend changes, and the price loses a crucial support level by forming a lower low on this particular time frame.
Trading in ranging markets differs significantly from trading in trending markets. The primary reason for this difference is that ranging markets can switch direction unpredictably and at short notice. While an uptrend often concludes with a double top (similarly, a downtrend concludes with a double bottom), a consolidation phase can prolong before either buyers or sellers lose control. In such situations, as mentioned earlier, it is prudent to wait for confirmation before making any assumptions about the market’s direction. This confirmation is typically achieved using Exponential Moving Averages (EMAs) and key price levels, which we will delve into in the upcoming week.
What Are Choppy Markets?
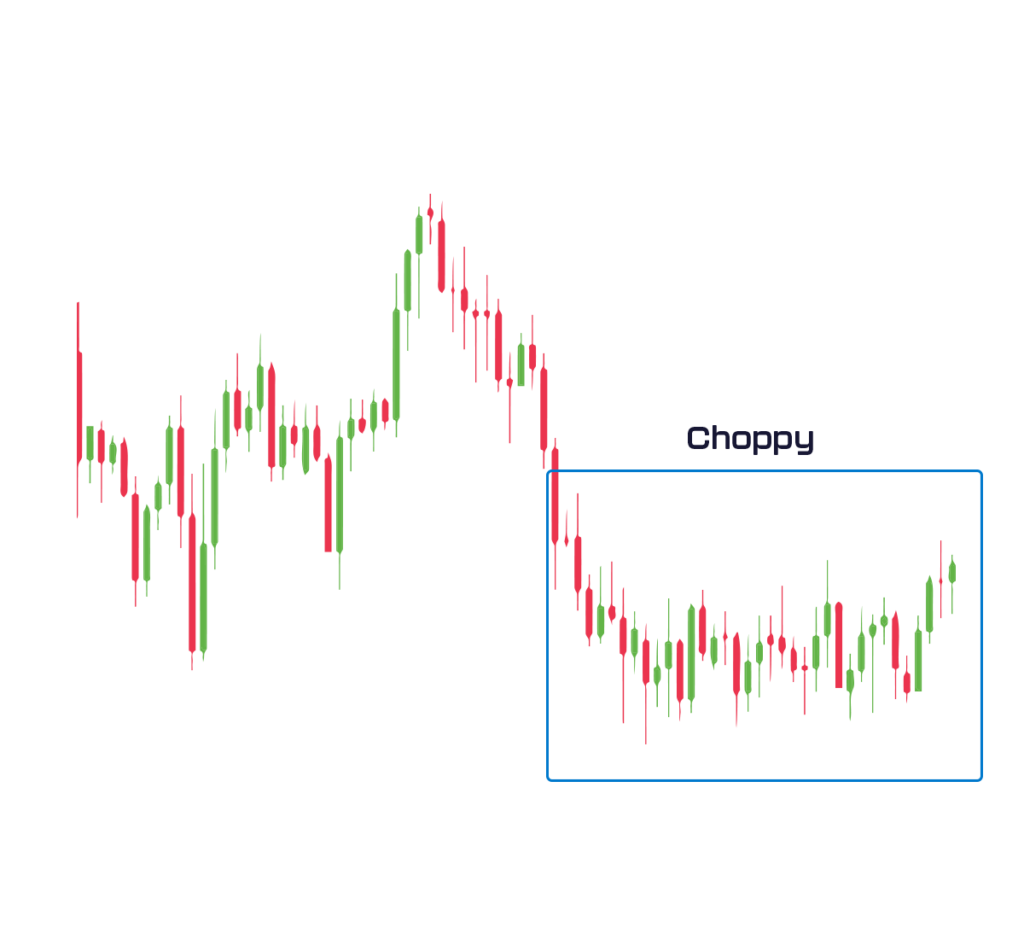
Choppy markets are characterized by a period of high uncertainty, where the price lacks a clear direction. During this phase, there is no definitive intent from either the buying or selling side. Unlike ranging markets, choppy markets do not exhibit identifiable support or resistance levels. The example below illustrates a choppy market. In such conditions, traders often encounter challenges in making confident trading decisions, as the price swings unpredictably without establishing a clear trend.
Conclusion
Market structure is a fundamental element that every chart analyst must grasp. It plays a significant role in decision-making and should always be taken into consideration. It’s essential not to complicate matters by impulsively reacting to every price surge or drop. Instead, waiting for confirmation, like observing a higher low after a series of lower lows, can provide valuable insights into the market’s current situation. This approach is especially crucial during choppy market conditions; patience is key.
Remember, the market is ever-present, and missing one opportunity may lead to another. The primary takeaway from this article is understanding the three general market structures: uptrend with higher highs and higher lows, downtrend with lower highs and lower lows, and sideways movement or choppiness, which can be identified through support and resistance zones.
Experience and practice are vital to becoming a successful chart reader. Technical analysis is not foolproof and should be used at your discretion. This series of trading articles aims to educate the community and should be seen as an educational tool.
In our next issue, we will explore EMAs, a crucial tool used by both traders and market makers. Stay tuned for more insights!
Bryan
Bryan indulges in every bit of crypto-related news
and material he can lay his hands on. As such, he
often shares his views and advice through the onXRP content platform. He is a firm believer in crypto’s
potential in the financial and economic world. With
5 years of experience in investing and trading Bryan
brings excellent insights to the table. He is excited to
bring much of this knowledge and many of his
skills to the onXRP platform.
We use cookies on our website to give you the most relevant experience by remembering your preferences and repeat visits. By clicking “Accept All”, you consent to the use of ALL the cookies. However, you may visit "Cookie Settings" to provide a controlled consent.
This website uses cookies to improve your experience while you navigate through the website. Out of these, the cookies that are categorized as necessary are stored on your browser as they are essential for the working of basic functionalities of the website. We also use third-party cookies that help us analyze and understand how you use this website. These cookies will be stored in your browser only with your consent. You also have the option to opt-out of these cookies. But opting out of some of these cookies may affect your browsing experience.
Necessary cookies are absolutely essential for the website to function properly. These cookies ensure basic functionalities and security features of the website, anonymously.
Cookie
Duration
Description
cookielawinfo-checkbox-analytics
11 months
This cookie is set by GDPR Cookie Consent plugin. The cookie is used to store the user consent for the cookies in the category "Analytics".
cookielawinfo-checkbox-functional
11 months
The cookie is set by GDPR cookie consent to record the user consent for the cookies in the category "Functional".
cookielawinfo-checkbox-necessary
11 months
This cookie is set by GDPR Cookie Consent plugin. The cookies is used to store the user consent for the cookies in the category "Necessary".
cookielawinfo-checkbox-others
11 months
This cookie is set by GDPR Cookie Consent plugin. The cookie is used to store the user consent for the cookies in the category "Other.
cookielawinfo-checkbox-performance
11 months
This cookie is set by GDPR Cookie Consent plugin. The cookie is used to store the user consent for the cookies in the category "Performance".
viewed_cookie_policy
11 months
The cookie is set by the GDPR Cookie Consent plugin and is used to store whether or not user has consented to the use of cookies. It does not store any personal data.
Functional cookies help to perform certain functionalities like sharing the content of the website on social media platforms, collect feedbacks, and other third-party features.
Performance cookies are used to understand and analyze the key performance indexes of the website which helps in delivering a better user experience for the visitors.
Analytical cookies are used to understand how visitors interact with the website. These cookies help provide information on metrics the number of visitors, bounce rate, traffic source, etc.
Advertisement cookies are used to provide visitors with relevant ads and marketing campaigns. These cookies track visitors across websites and collect information to provide customized ads.