In the realm of technical analysis (TA), support and resistance take center stage as vital components. These zones offer traders invaluable market insights and serve as pillars for making sound decisions when correctly applied.
Understanding support and resistance levels empowers traders to navigate price movements with confidence, identify potential entry and exit points, and develop robust trading strategies.
By harnessing the power of support and resistance, traders can enhance their ability to read the market, leading to more informed and successful trading outcomes.
Understanding Support: Identifying Buying Pressure Zones on the Chart
Support, also known as the support zone, plays a vital role in trading analysis. It refers to a specific location and time on the chart where “buying pressure” is evident. In such zones, the supply of the cryptocurrency typically decreases, while the demand for it increases. This imbalance in supply and demand often results in a corresponding price increase, following the basic rules of shortage—where investors are willing to pay a higher price to fulfill their demand. To illustrate this concept further, let’s delve into a practical example:
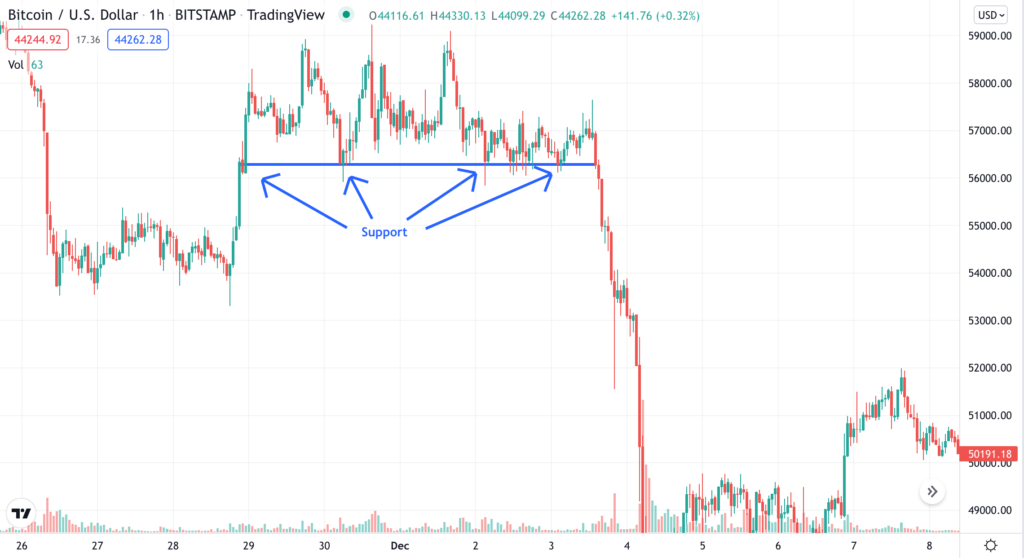
Tradingview: BTC/USD Pair Support November/December 2021
Back in November 2021, during the notorious ‘it can’t go any lower than 52k’ market downturn, support emerged as a formidable force. The price showed resilience, refusing to drop below the critical horizontal line at approximately 56.5k. This unwavering support indicated a surge in buying activity at that specific price level.
Support often takes on the role of a psychological barrier, commanding the attention of traders and hodlers alike. Whether it’s a round number or a price derived from valuations like market cap or technical indicators like EMAs and Fibonacci levels, support holds significance in the market.
When the price approaches a support level, investors and traders view it as a crucial structure, leading to “bounces” where the price reverses its direction. On the other hand, sellers tend to halt their selling activities around that price level, hoping to fetch a higher price for their assets. This delicate balance between buyers and sellers helps stabilize the market.
By recognizing and understanding support levels, traders can make more informed decisions, gauging the market sentiment and potential price movements. As the market constantly evolves, mastering the concept of support becomes an essential tool for successful trading.
Unlocking the Concept of Resistance: A Guide to Trading Strategies
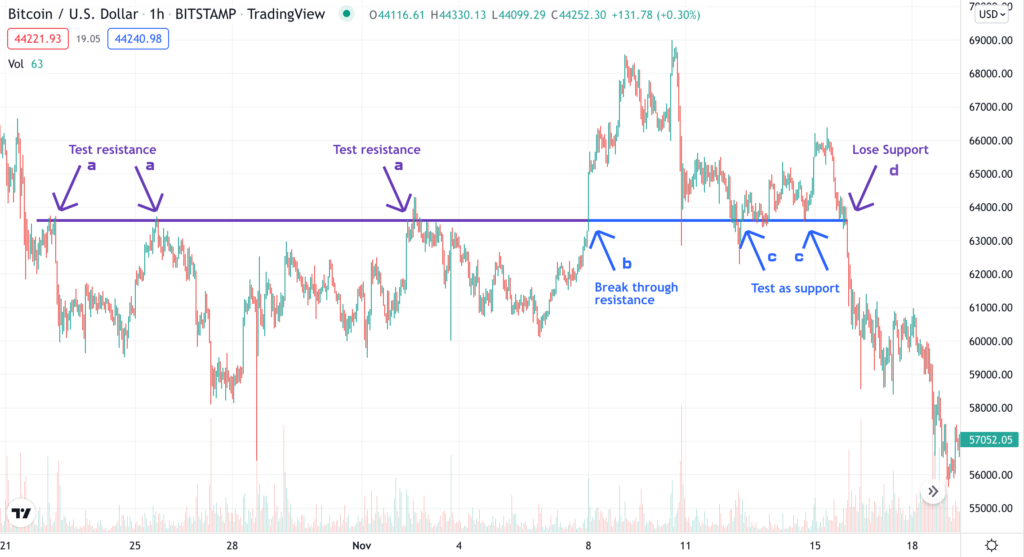
In trading, a resistance zone acts as the opposite of a support zone. In a recent example involving BTC/USD, as the cryptocurrency began its correction towards the end of last year, the price encountered a significant upper barrier that resisted its upward movement multiple times (a). Investors closely watched this key resistance level as it held the potential to determine the market’s course.
Eventually, after repeated attempts, the price managed to break through the resistance (b). However, this breakthrough hinged on two critical factors: the level of buying volume and the ability to overcome the selling pressure.
The interaction between buying and selling volumes plays a crucial role in determining whether a resistance level will hold firm or give way to further price movement. Traders carefully assess these dynamics to make informed decisions and capitalize on potential trading opportunities.
By understanding resistance zones and closely monitoring market trends, traders can gain valuable insights into market behavior, enabling them to navigate corrections and price movements with greater confidence.
Tradingview: BTC/USD Pair Support & Resistance October/November 2021
When a price successfully breaches a resistance point, an interesting phenomenon occurs—the resistance can “flip” and transform into a support level, as observed in point c. Conversely, the reverse can also happen, where a support level converts into a resistance zone.
In the event that selling pressure gains momentum, as depicted in point d, the price can break below the established support level. This situation often arises due to an influx of supply surpassing the demand, leading to an imbalance in the market. Consequently, the market structure is temporarily disrupted, causing the price to decline until it discovers a new level of support.
Understanding the interplay between resistance and support levels is a fundamental aspect of market analysis. Traders closely observe these critical junctures to identify potential turning points in price movements and formulate effective trading strategies.
In the dynamic world of trading, recognizing the shifts between resistance and support zones can provide traders with valuable insights, helping them make more informed decisions and navigate market fluctuations with greater proficiency. By staying vigilant and analyzing market patterns, traders can better position themselves for success in this ever-evolving landscape.
Conclusion
Integrating support and resistance levels with other indicators is crucial for optimal results. When enough traders adopt these levels, they become self-fulfilling and highly tradable. As fundamental tools, support and resistance should be part of every trader’s toolkit, continuously monitored alongside price action. Achieving trading success involves a holistic approach, utilizing these insights to make informed decisions and achieve better outcomes.
Bryan
Bryan indulges in every bit of crypto-related news
and material he can lay his hands on. As such, he
often shares his views and advice through the onXRP content platform. He is a firm believer in crypto’s
potential in the financial and economic world. With
5 years of experience in investing and trading Bryan
brings excellent insights to the table. He is excited to
bring much of this knowledge and many of his
skills to the onXRP platform.
We use cookies on our website to give you the most relevant experience by remembering your preferences and repeat visits. By clicking “Accept All”, you consent to the use of ALL the cookies. However, you may visit "Cookie Settings" to provide a controlled consent.
This website uses cookies to improve your experience while you navigate through the website. Out of these, the cookies that are categorized as necessary are stored on your browser as they are essential for the working of basic functionalities of the website. We also use third-party cookies that help us analyze and understand how you use this website. These cookies will be stored in your browser only with your consent. You also have the option to opt-out of these cookies. But opting out of some of these cookies may affect your browsing experience.
Necessary cookies are absolutely essential for the website to function properly. These cookies ensure basic functionalities and security features of the website, anonymously.
Cookie
Duration
Description
cookielawinfo-checkbox-analytics
11 months
This cookie is set by GDPR Cookie Consent plugin. The cookie is used to store the user consent for the cookies in the category "Analytics".
cookielawinfo-checkbox-functional
11 months
The cookie is set by GDPR cookie consent to record the user consent for the cookies in the category "Functional".
cookielawinfo-checkbox-necessary
11 months
This cookie is set by GDPR Cookie Consent plugin. The cookies is used to store the user consent for the cookies in the category "Necessary".
cookielawinfo-checkbox-others
11 months
This cookie is set by GDPR Cookie Consent plugin. The cookie is used to store the user consent for the cookies in the category "Other.
cookielawinfo-checkbox-performance
11 months
This cookie is set by GDPR Cookie Consent plugin. The cookie is used to store the user consent for the cookies in the category "Performance".
viewed_cookie_policy
11 months
The cookie is set by the GDPR Cookie Consent plugin and is used to store whether or not user has consented to the use of cookies. It does not store any personal data.
Functional cookies help to perform certain functionalities like sharing the content of the website on social media platforms, collect feedbacks, and other third-party features.
Performance cookies are used to understand and analyze the key performance indexes of the website which helps in delivering a better user experience for the visitors.
Analytical cookies are used to understand how visitors interact with the website. These cookies help provide information on metrics the number of visitors, bounce rate, traffic source, etc.
Advertisement cookies are used to provide visitors with relevant ads and marketing campaigns. These cookies track visitors across websites and collect information to provide customized ads.